
The Lightroom Histogram Explained
Most photographers have been at the point where they realize they should probably understand this histogram better. We are here to make it a little easier to grasp. Grasping the histogram allows photographers to improve their images in ways the eye can’t see. You can use it to identify RGB values and clipping indicators as well as a tool that explains where to make Basic Panel adjustments. Here are a few tips to help creators understand and use the LR histogram in their workflow.
First off, the histogram can be found at the top right corner of the Library and Develop Modules. Note, that the develop tab is most useful as it is where changes can be made to the histogram.

What is a histogram?
The histogram is a graphical representation of the tones and colors in a photo. It measures the brightness of an image by representing the frequency of each tone as a value on a chart. Photographers can learn a lot about their images from being able to read the histogram properly.

With photography, there are two types – the image histogram, and the color histogram. The image histogram shows the number of pixels related to the tonal distribution and value of an image – the grey. The color histogram shows just that, the color and saturation of an image – the colorful.
Breaking It Down
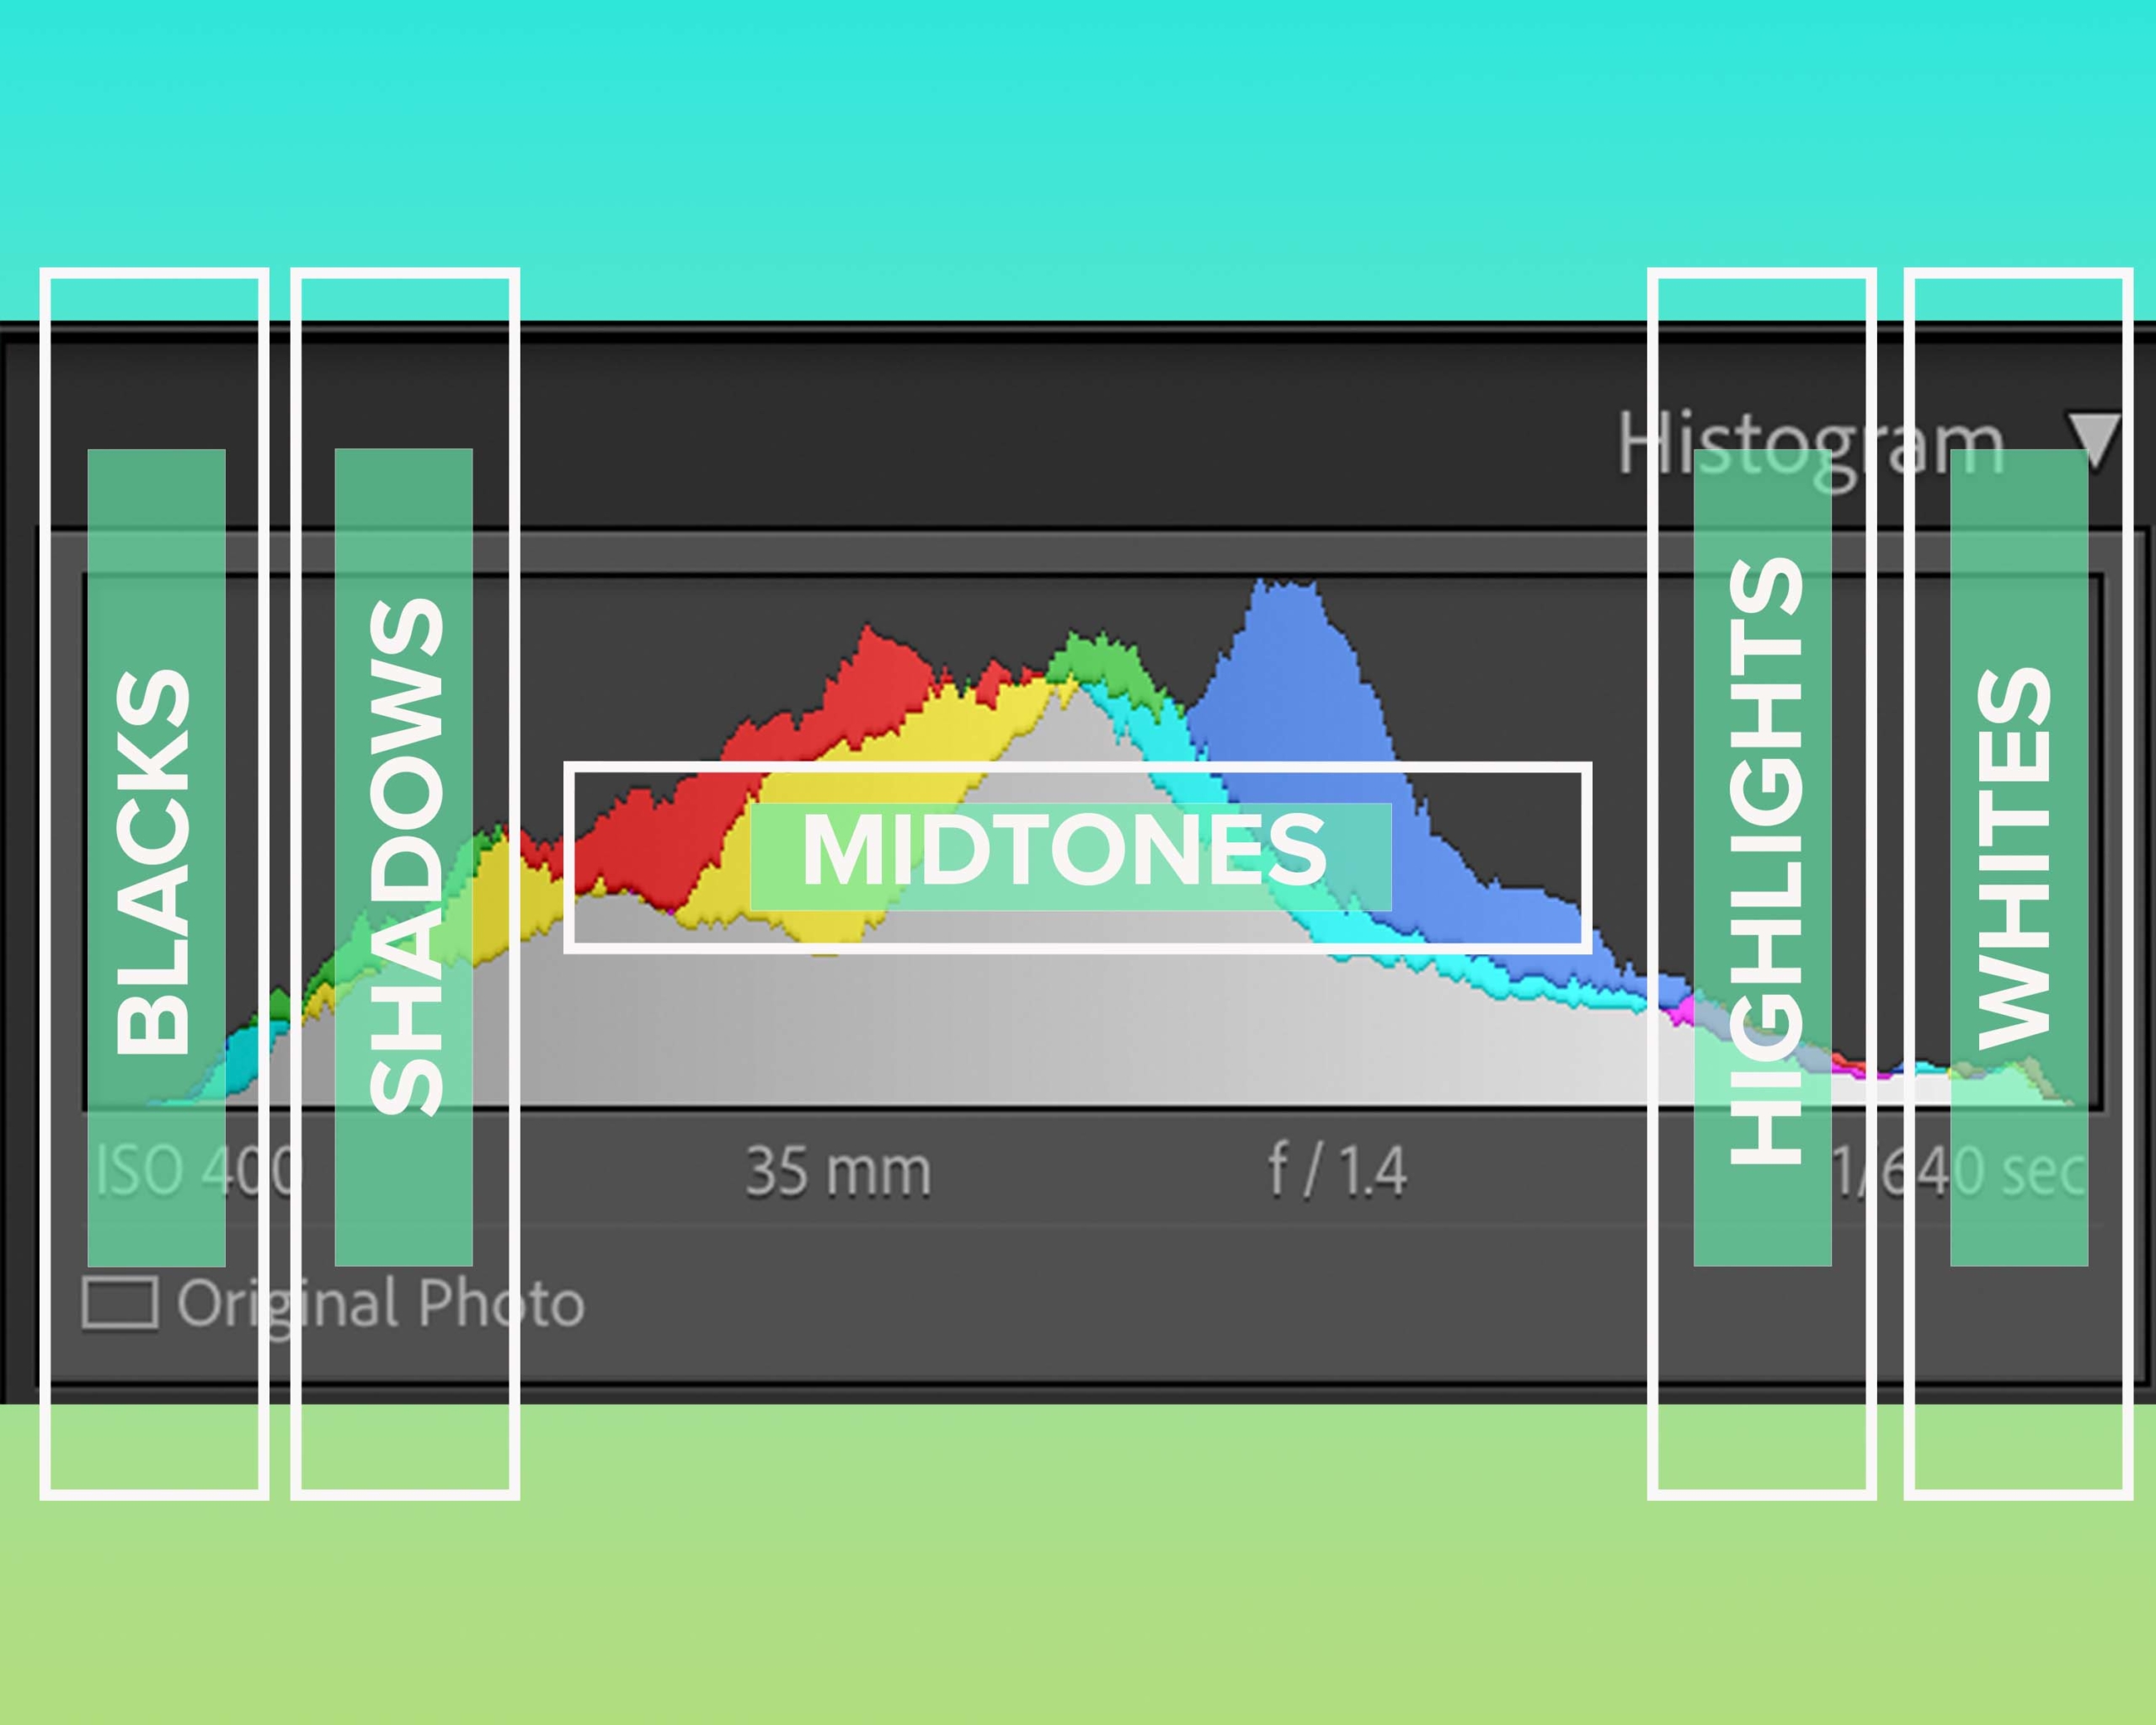
Learning to read the histogram starts with understanding the graph, peaks and troughs presented. The horizontal axis moves from the darkest to lightest. The vertical axis represents the frequency or intensity of each tone, with peaks for high frequency and valleys for low.
The left side represents pure black, this is where the pixels are so dark that the eye cannot differentiate and see details. Shadows are graphed just to the right of the blacks. These tones are also dark but the eye can differentiate some detail and color.
The middle represents midtones or grey tones. This is where the eye can differentiate between clear details and different colors.
The right side represents pure white, this is where tones are so bright that details and colors cannot be differentiated. Highlights are graphed just to the right of the whites. High tones are where there are bright colors with less contrast making details more distinguishable.
It is important to understand that there is no such thing as a perfect histogram. The histogram will vary with style, time of day, season, and more. The diverse range of tones that can be in an image will change what the histogram looks like.
Example pics – black background, snow pic etc.
Understanding the Colors of the Histogram
The histogram shows color distribution through having three tonal graphs, red, green and blue, overlaid on top of each other.

-The grey color represents areas that are a mixture of all three (Red, Blue, & Green) .
-Where red overlaps green, yellow is displayed.
-Where blue overlaps green, turquoise is displayed.
-Where red overlaps blue, magenta is displayed.
By hovering your cursor over an image, the percentages of red, green and blue in that area appears underneath the histogram.
Finding Clipped Areas using the Histogram
The histogram can help you check if there are any clipped areas in your image. A clipped area is when either the highlights are burnt and an image over-exposed or when the shadows are black and burnt out. If there are peaks on the far edges of your histogram, you may be clipping certain tones.

Hover over the small triangles found in the upper right and left corners of the histogram to reveal which tones are being clipped and the areas of your photo where this is happening. There is also a shortcut by pressing “J” on your keyboard, this will allow you to toggle clipped values on and off. Lightroom will mark the clipped shadows in your image with blue. The clipped highlights will appear in red.
To fix any clipping in your image, you’ll want to change one or more of the areas mentioned above (blacks, shadows, highlights, or whites). You can do this by dragging that specific section of the histogram to the left or right or by using the sliders in the Basic panel. Play around with these options until you have either removed or reduced the clipping to the desired amount.
As you can see, the histogram in Lightroom is a very valuable tool, it provides a few features to make the photography workflow faster. Now that you know more of what the histogram is showing you, it is time to put it to practice and create!
There are many awesome Lightroom tools that can improve creators’ workflow, including plugins. There are a plethora of available plugins to explore, be sure to check out JPEGmini. It is an easy tool that will optimize your images by shrinking file size while maintaining full image quality.